Showing Science posts. Go back home.
-
My CompSust'12 Presentation
Here are the slides from my talk on our Flight emitter at CompSust’12.
I basically gave a quick overview of the model and then summarized some findings from the Air Travel Carbon and Energy Efficiency paper we released last year.
-
CompSust'12
I’m just back from the 3rd international conference on computational sustainbality in Copenhagen, Denmark. A beautiful scandinavian city, a jazz festival, and the latest on using machine learning and linear programming to develop intelligent energy management systems, integrate electric vehicles into the electricity grid, and optimize logistics - who could ask for more?
-
2012 Fuel Economy Data
Another data update - you can now find the fuel economy and other info for all 2012 model-year automobiles sold in the US in our public data repository.
This data release took unusually long to process because we decided to improve the way we handle dual-fuel and alternate fuel vehicles in light of their increasing popularity. We now store all EPA-reported fuel efficiencies for every vehicle. Using the Automobile or Automobile Trip impact models on Cm1 you can specify a particular fuel with the ‘automobile fuel’ characteristic.
-
Electric Utility Data
We’ve just added US electric utilities to our public data repository. Our current data includes which zip codes each utility serves (from the EIA) and whether the utility has committed to or already begun giving customers access to their own energy information through the Green Button program.
-
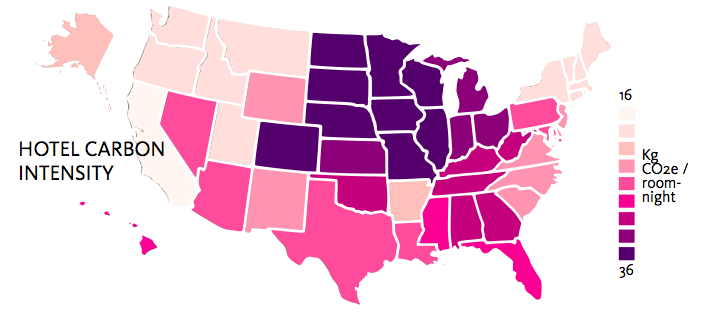
A new perspective on hotel sustainability
We have released the results of our latest research, focused on assessing the efficiency of 46,000 individual US hotels. The report, Hotel Carbon & Energy Efficiency, presents efficiency rankings for 75 of the largest hotel chains, examines key drivers of efficiency, and analyzes industry trends.
-
Prius vs. Volt Reprise
Following the surge in sales of the Chevy Volt in March, we thought it could be interesting to revisit our post from August 2009 comparing the greenhouse gas emissions of the Volt to the Toyota Prius.
Sneak peak: the Prius still rules in most of the US.
-
New flight data from ICAO
We’ve just incorporated the latest ICAO flight stage data into our flight carbon and energy model. The update includes data for international flights in 2009, 2010, and 2011 and adds several new airlines, such as Air Bucharest, Mihin Lanka, and UTair-Ukraine. It also adds some new direct routes such as Accra to Algier, Malaga to Moscow, and Zurich to Yerevan.
-
Will premium gasoline improve your fuel economy?
This morning’s NPR marketplace included a list of money-saving tips for drivers. Most are spot-on, but one surprised me: the recommendation that everyone use 91 octane premium gasoline.
Numerous sources including the Federal Trade Commission, Scientific American, and the California Energy Commission have debunked the myth that a higher octane rating will give you a performance boost or keep your engine cleaner. Possibly alluding to this, the tip claims that premium gasoline is better “because it’s more filtered, not because of the octane.”
Since all grades of gasoline have the same energy content I’m skeptical that any slight difference in purity could make up for a roughly 7% price premium.
My take: follow the other tips but stick with regular unleaded.
-
State electricity emission factors from eGRID
Last week I was trying to calculate the greenhouse gas emissions for each building in the EIA Commercial Building Energy Consumption Survey (CBECS) microdata. Fuel oil and natural gas emissions were easy enough, but electricity emissions posed a problem.
The standard way to calculate electricity emissions in the US is to use EPA eGRID emission factors. To do this I needed to know the eGRID subregion each building was in. Usually I’d use data from the EPA power profiler tool to look up the eGRID subregion for each building’s zip code. But to ensure anonymity CBECS doesn’t report a building’s zip code or even state, just its census division.
-
Inferential modeling - fuzzy sets vs. cohorts
Inferential modeling is a big part of our R&D at Brighter Planet. Our impact models are designed to estimate the energy use of some activity without necessarily knowing all the variables that directly drive energy use.
For example, let’s say we want to model the energy use of a modest weekend at the Bellagio in Vegas. We know some information like the local climate and building size, but we don’t know the Bellagio’s exact energy demand. What’s the best way to estimate it?
-
Meet our turbocharged lodging model
We’ve just rolled out the latest version of our hotel energy and emissions model, and it includes a number of new advancements that make lodging sustainability quantification more accurate, broadly applicable, and useful than ever before.
Corporate travel is a fast-growing focus for sustainability managers, and we’re excited about the opportunities these new capabilities will give CM1 clients to empower smarter decision-making in this area.
This latest version includes four major upgrades:
-
Keystone: "XL" is pretty apt
We’re in the midst of 24 Hours to Stop Keystone XL, a day-long push by 35+ organizations to send half a million letters to Senators asking them to stop the pipeline. It’s a worthy, urgent cause and we at Brighter Planet will all be sending our letters today.
Naturally we were tinkering with some of the numbers related to Keystone, and one question jumped out at us: Just how much CO2 emissions are represented by the oil in KXL at any given point in time?
To get an answer we used CM1’s Fuel Purchase impact model, feeding in the total volume of the pipeline extensions1, along with the type of oil (in this case, crude). The result:
2.4 million tons CO2e
That’s the GHG emissions represented by the oil that would be inside KXL at any point in time. Here’s the methodology.
“XL” is right.
-
Wikipedia tells us the radius and length of the two extensions that make up the “XL” part of Keystone. We plugged that into Wolfram Alpha to get the volume. ↩
-
-
The top 3 things I saw at the Detroit Auto Show
One of the benefits of living in Michigan is getting to swing over to the North American International Auto Show in Detroit. Here are the most interesting sustainability themes I noticed this year.

-
New data from Northstar Travel Media
We’re close to finishing some exciting updates to our Lodging model: soon it will be able to identify the actual hotel a client stayed at and use that property’s physical characteristics to calculate energy use and emissions.
A key piece in this process is the hotel database we just purchased from Northstar Travel Media.
-
Three big trends in employee sustainability engagement
Two years ago we reported the results of our first survey on employee sustainability engagement, to a surprising amount of interest from non-profits, businesses, and governments. Today we’re releasing our second biennial survey results on the subject, updating the picture of engagement initiatives, digging deeper into best practices for effective programs, and analyzing trends in this fast-evolving space.
-
New best practices for green data providers
This is a time of unprecedented threat to the environment brought about by increasing population and consumption – but it’s also an age of unprecedented opportunity for innovating solutions to these challenges. Increasing migration of daily decisions and activities to cyberspace, and increasing availability of valuable data resources, are giving software developers more opportunity than ever to build data-driven apps that power more sustainable decisions. The movement to build data-driven green apps is just getting started, and the government, business, and non-profit organizations with the data to power these innovative tools have an important role to play in helping ensure their success.
That’s the focus of our latest report, entitled Growing the Green Apps Ecosystem. The paper, edited by Ethan McMahon at the EPA’s Office of Environmental Information, outlines best practices for data providers in engaging green developers and ensuring their data provision is as developer-friendly as possible. The paper combines the results of interviews we conducted with various green developers, our own experience working with data providers and green apps, and Ethan’s fact-checking perspective as an EPA official helping lead the movement for green apps innovation.
In the paper we reassess open data practices for data providers, explaining how a focus on data orientation and life cycle can help ensure that open data practices actually meet developer needs. We also outline seven tactics for engaging developers in the creation of green apps, including hackathons, APIs, contests, and data support channels. You can read the full report here.
-
Greenhouse Gas Protocol releases new standards
Last week the Greenhouse Gas Protocol released the final versions of two new accounting standards: the Corporate Value Chain (Scope 3) and Product Life Cycle standards. The new standards provide a harmonized framework for companies to measure and report indirect greenhouse gas emissions throughout their value chain.
This news is very exciting to us at Brighter Planet. From the beginning our goal has been to provide companies and individuals with a comprehensive view of their greenhouse gas emissions. So we’re thrilled to see the establishment of a standard set of rules for calculating indirect emissions, especially as they corroborate many of the decisions we’ve made when building our emissions models.
-
Engaging Employees on Sustainability
Our second annual workplace sustainability survey, currently underway, is analyzing trends and best practices in the rapidly growing field of employee environmental engagement. My recent post over at Environmental Defense Fund business blog explains the details:
Plenty of government agencies and private businesses boast that they are engaging their employees in sustainability programs to green their workplaces. But which employers are really giving their employees the information they need to make their organizations more environmentally-friendly? […]
Head here to read the full post: http://blogs.edf.org/innovation/2011/10/05/how-green-is-your-workplace/
-
How Green is Your Workplace?
 {.wrapped} This month we’re conducting our second annual employee engagement survey, co-sponsored by Conservation International’s Business & Sustainability Council. The survey will benchmark what businesses are doing to involve employees in sustainability and analyze evolutions since last year. We hope you’ll participate and also share the survey with your colleagues. To sweeten the deal, we’ll hand out $200 to a randomly selected respondent!
Survey link after the jump →
-
A new perspective on air travel management
These days more and more organizations are measuring the carbon impacts of employee air travel programs. That’s a good thing. Unfortunately, most are using a simplistic approach that leaves one of their hands tied when it comes to managing those programs for reduced carbon impact. Correcting this business intelligence shortfall is the focus of our latest research paper, an in-depth modeling analysis of more than a decade of global airline industry data.
-
A closer look at public data cleanup
Our CM1 carbon models depend on lots of public energy and emissions data relating to things like buildings and transportation—mostly from government sources like the EIA, BTS, and EPA. Whenever you use or mash up a large dataset you’ll likely run into issues like inconsistent file layouts, awkward formats, and human error. So file cleanup is a large part of the process we go through when plugging data into our system and making them available in our free data clearinghouse. Here’s a quick look at three of the main things we do; we’ll delve into more specifics in subsequent posts:
-
Our latest tool, rapid lifecycle carbon assessment
Calculating the exact lifecycle carbon footprint of everyday goods and services is a laborious and often prohibitively expensive process. A few months ago, we set to work building a tool to help organizations get a jump start on estimating the emissions associated with the things they buy. Our goal was a flexible emissions model that could efficiently process existing data streams to calculate carbon estimates as far back through the value chain as possible for a wide spectrum of goods and services.
The result is our new purchase carbon model, released today (see the press release). It uses an advanced environmental economic input-output model to calculate a full cradle-to-consumer lifecycle carbon footprint. It works for any product or service. And it can be used automatically in a system that, for example, processes financial transaction data already present in your electronic banking records and procurement logs, giving a quick impression of the hotspots in your purchasing patterns.
To see a demo of the tool in action, check out Fedprint, a quick mashup that brings the purchase carbon model to bear on America’s largest consumer the, US federal government. Updated hourly, it spotlights the carbon footprint of the most recently awarded contracts in the Federal Purchase Data System.
For developers, the purchase model is live for experimentation and production use on Carbon Middleware. A few developer links: vehicle purchase (methodology), office supplies (in JSON), carbon model source code, API documentation
-
EPA releases new guidance on emissions reporting for federal agencies
This Tuesday the EPA released official guidance for federal agencies on measuring and reporting GHGs. The guidance serves as the government’s official GHG Protocol, outlining precisely what agencies need to measure and report to comply with Executive Order 13514.
A potential ‘surprise’ is that for Fiscal Year 2010 reporting (due January 2011) the guidance only requires Scope 3 emissions from employee business ground and air travel, employee commuting, contracted solid waste and wastewater disposal, and electricity transportation and distribution losses. Executive Order 13514 originally required agencies to also report emissions from leased buildings, the production of fuels used in agency vehicles, and vendors, contractors, and supply chains. But because Scope 3 accounting is new and “recognized methods for calculating emissions are just emerging,” these and other Scope 3 sources will be phased in over time.
-
Learning from Climategate
I was honored to be invited to the annual technology-and-social-change gathering Web of Change this year, and even more excited that I was able to make a presentation.
I’m embedding the slides and a video which was kindly shot by Mr. Ian Rhett. The presentation is in Ignite style, so it’s a total of five minutes long.
-
Back From JRubyConf
I just got back from JRubyConf in Columbus, Ohio. I had a great time meeting other Rubyists and learned a great deal about how Ruby is being integrated into enterprise environments via JRuby. It’s really exciting to see “the big guys” embracing a language and ecosystem that we at Brighter Planet enjoy using on a daily basis.
When I got back home, I decided this would be a good opportunity to try out our new meeting and lodging emissions models to come up with a carbon footprint for my trip to the conference.
I started out with the meeting space itself. I fired up Google Earth and measured the square footage of the conference center we were at - about 1,150 square meters. With the area of the space and the location, I came up with 3.08 tons of CO2e generated by the heating, cooling, and electricity usage of the space: methodology. Of course, if we considered my individual footprint, it would be 150th of that amount, given that 150 of us shared the space. This comes out to 0.02 tons.
I then looked at my hotel stay for two nights at the Hampton Inn and came up with 0.09 tons of CO2e: methodology. I looked up the lodging class from our data repository
To get to the conference, I carpooled with a couple other Rubyists from Ann Arbor, Michigan. I used 18 gallons of gas, which comes out to 68.1L. When we developed the automobile trip emitter I was surprised to learn from Seamus and Ian that the type of engine you have doesn’t make a significant difference in the amount of CO2 emitted, it really comes down to how much gasoline is burned. Therefore, our automobile trip emitter looks at the type of fuel and the quantity burned. Transportation to and from the conference came out to 0.18 tons of CO2e: methodology. Divided by the three of us, my personal transportation footprint was 0.06 tons.
Of course, no conference weekend is complete without a few good meals with fellow programmers. Over the course of the weekend, I mostly ate vegetarian, but I splurged on a trip to City Barbecue for a tasty beef brisket sandwich. I looked at all the food I ate, and calculated the share of each of the food groups I ate. My foodprint for the weekend was 0.02 tons of CO2e: methodology.
Overall, my total footprint was 0.19 tons of CO2e. Had I not carpooled, the biggest factor would have been the car trip to the venue. With carpooling, most of my emissions came from the hotel stay.
Over the past few years, there have been more and more regional Ruby conferences, and it’s great to see the community buzzing. I think it would be really cool if someone could whip up a web app that analyzes Ruby (or other) conference footprints, perhaps based on data gathered from attendees. We could make a competition out of it to see which conference has the best average per-attendee footprint!
-
Our carbon gem is now also a command-line carbon calculator
Version 0.3.0 of the
carbongem—our Ruby wrapper for the emission estimates service API—includes “command-line access” to the web service:# `carbon` carbon-> key '123ABC' => Using key 123ABC carbon-> flight => 1210.66889895298 kg CO2e flight*> origin_airport 'lax' => 1461.63846640404 kg CO2e flight*> destination_airport 'jfk' => 1733.79410872608 kg CO2e flight*> url => http://carbon.brighterplanet.com/flights.json?origin_airport=lax&destination_airport=jfk&key=123ABC flight*> done => Saved as flight #0 carbon-> exit(Notice that you’ll need a developer key to use this or any other Carbon Middleware-powered library.)
We think this feature might be especially useful to researchers and scientists who want to make “quick” calculations but still want to rely on our rigorous, transparent carbon models.
For complete documentation see the README.
Go ahead and give it a try!
$ gem install carbon $ carbon carbon-> -
Calculating hotel emissions
Following up on our recent release of an event module for our carbon middleware service, we’re excited to announce the release of a lodging module.
Developers can now use our API to calculate emissions from hotel energy use within their own applications. The calculations use data from the EIA’s Commercial Buildings Energy Consumption Survey and the EPA’s eGRID, which are automatically imported to our database and updated nightly to ensure currency.
Possible applications of the lodging emitter include a company calculating Scope 3 emissions from business travel, a hotel booking website calculating your stay’s emissions, a travel agent adding offsets for lodging emissions to a vacation package… but don’t let us limit your thinking!
We’re hard at work cranking out more emitters, so stay tuned for updates.
-
Event carbon calculation added to middleware toolkit
For years we’ve been doing custom carbon emissions inventories for meetings and events ranging from conventions and conferences to music festivals and sporting events. Now we’ve released a new meetings module of our carbon middleware service that lets software developers build event carbon calculation into their own applications.
The meetings and events emitter, accessed through our API, lets users specify a range of characteristics to calculate emissions from venue energy use. Used in combination with other carbon middleware emitters like transport, hotel stays, food, and fuel purchases, an event inventory can be expanded to cover the desired emissions scope.
Underpinning this event carbon model are authoritative data from the EIA’s Commercial Buildings Energy Consumption Survey and the EPA’s eGRID, imported automatically to our system on a daily basis to ensure currency.
We’re excited to see website and software developers put the tools to use. We’ve got applications in mind ranging from widgets that let wedding and party planners estimate their impact, to platforms that enable corporations to manage all aspects of convention and summit carbon footprints. But IT engineers will no doubt surprise us with innovative ways to integrate this carbon data into their systems.
Events and meetings can be great opportunities not only to meet your organizations’ own sustainability goals, but also to promote conservation by helping to enlist participants and attendees in the emissions calculation and reduction process. In working with event organizers we’ve had great success using a four-pronged approach that addresses event carbon inventorying, emissions reduction initiatives, mitigation through offsetting, and attendee participation in measuring, reducing, and offsetting their own event travel emissions.
-
Expanding lifecycle analysis capabilities with EIO-LCA data
We’re pleased to announce that we’ve just added the Economic Input-Output Life Cycle Assessment (EIO-LCA) model to our carbon data resources. Licensing this authoritative model further expands our ability to perform lifecycle and supply chain carbon emissions analysis.
The carbon accounting field is increasingly focusing on Scope 3 emissions, including supply chain and product lifecyle emissions. Supplier sustainability programs by institutions like Walmart, IBM, P&G, and the federal government are driven by the realization that for many organizations, embodied emissions represent the majority of total carbon impact.
The EIO-LCA model from Carnegie Melon University’s Green Design Institute combines federal Economic Census data with research on the environmental impacts of hundreds of economic sectors. It enables lifecycle assessment for all phases of production including raw materials extraction, transport, manufacturing, and retail.
Through our new partnership with CMU, Brighter Planet will provide rapid environmental impact analysis for goods and services such as electronics, food, healthcare, vehicles, consulting, entertainment, clothing, and supplies.
-
2010 on track for record high temps
It’s that time of the month again – the week when NOAA scientists release last month’s “combined global surface temperature” data – and we’ve got yet another winner. It was the warmest April on record, hot on the tail of the warmest March.
The March and April heat was more than enough to pull the entire four-month January–April average into record territory, despite January and February having been merely the fourth- and sixth-warmest on record.
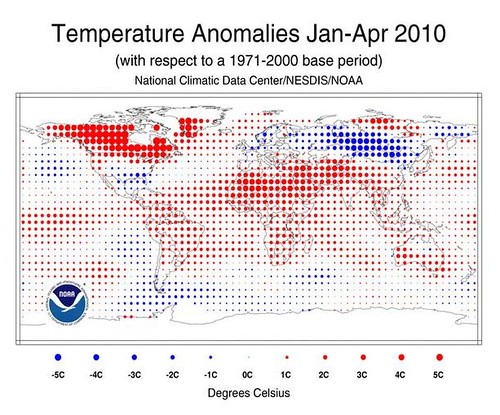
Yes, you’re reading that correctly: the North American Arctic has been about 9 DEGREES FARENHEIGHT (5 C) warmer than average these last four months. Yikes.
Expect to see more of the same as we move into the rest of 2010: NASA researchers predict the trend to continue, forecasting that 2010 will weigh in as warmest year in recorded history.
The effects? Well for one, warmer sea surface temperatures are a key element in predictions by folks at CSU, NCSU, and Accuweather that the 2010 Atlantic hurricane season (which opens on June 1) will be significantly more active than average and “has the chance to be an extreme season.” Critics have called the Gulf oil spill “Obama’s Katrina”, but chances appear better than average he’ll get a literal Katrina of his own.
–Matthew
-
GOOD infographic: Household Carbon Emissions and What You Can Do
This Earth Day our friends at GOOD asked for our help illustrating household emissions and tips for reducing them. We shared some data, and they produced this beautiful infographic:

-
Employee sustainability survey results: the good, the bad, the ugly

We’ve finally wrapped up the crunching, sifting, charting, and interpreting of the 30,000+ datapoints collected in our recent online survey about the employee engagement practices of US employers. Thanks to all of you who took the time to respond to the survey questions. Today we released the report that details our findings.
Mindy Lubber, president of Ceres (and Brighter Planet advisory board member), signed onto the cause with her contribution of the foreword. As she says, “This report from Brighter Planet both provides a benchmark for the status of employee sustainability programs in the US as they continue to evolve, and helps to inform their development by highlighting factors that contribute to their success. We look forward to watching employee engagement initiatives play an increasing role in helping our institutions to overcome the challenges of our time.”
Here are a few of the findings at a glance. Download the complete report to get the full results and insights.
- Most employers have only just begun interacting with employees around sustainability, and their efforts leave room for improvement. Although 86% of respondents said their organization promotes employee sustainability in some arena, only 16% said their employer collects data related to employee sustainability and just 14% said their employer had an official employee sustainability engagement policy.
- Small organizations are leading on employee sustainability engagement. Organizations with fewer than 100 people are nearly twice as likely to promote sustainability very frequently, and their efforts are twice as likely to be effective at changing employee behavior.
- The most effective engagement programs feature an organization’s management or board as the main advocate for employee sustainability. These programs are three times as effective as those in which an employee sustainability director was the main advocate.
- Employees are generally dissatisfied with their employers’ sustainability engagement efforts. Over 60% of respondents want to learn more about their employers’ and co-workers’ sustainability efforts, and 67% would like their employers to change their stance on sustainability.
-
Eat your way to a healthy climate: new report

Wanted to share with you all a white paper that we just put out, entitled “The American Carbon Foodprint: Understanding and Reducing your Food’s Impact on Climate Change”. Using the emissions model that we built to power the footprint calculator on this website, we analyzed the cradle to grave climate impacts of the average diet, and pulled the results together in a report that explains and interprets them. It turned up some pretty enlightening (and sometimes rather surprising) stuff – good background for anybody who is into understanding the food they eat.
A few highlights:
- The average American’s carbon “foodprint” is 6.1 tons of CO2e a year. That’s bigger than the combined impact of all their driving and flying.
- Production accounts for close to half of a meal’s total climate impact, and red meat is by far the most potent emitter of all the food groups.
- Of all the transportation emissions associated with your food, less than a tenth result from delivering food from the producer to the vendor, while more than two thirds result from your own driving to grocery stores and restaurants. That puts the importance of “food miles” in perspective!
- Kitchen energy accounts for 29% of a meal’s life cycle impact. Cooking at home is far more carbon-efficient than eating in restaurants.
Yes, the climate impact of our dining habits is substantial. But it’s pretty straightforward for each of us to make changes that significantly reduce those impacts. We distilled the learnings into seven take-home tips:
- Eat fewer animals and more plants
- Buy unprocessed foods with less packaging
- Grow and harvest your own food
- Minimize car trips to restaurants and stores
- Cook at home more and eat out less
- Cook with efficient appliances and techniques
- Compost, recycle, and relish leftovers
Check out the full paper to get answers to all the carbon foodprint questions you never knew you had, and let us know what you think.
–Matthew <p style="text-align: center;">
 </p>
</p> -
Fly green, for real
In a recent post on Fast Company, we ranked the major US airlines by climate impact per passenger.
We started with data from the Bureau of Transportation Statistics’ T-100 database, a collection of monthly reports from every airline that is certified to fly in the US. We took factors like flight distance, aircraft model, number of passengers, and amount of freight carried, combined them with aircraft fuel use equations from the European Environment Agency, and ran the lot through our emissions engine. (Fun fact: the calculations took about 15 minutes on a standard household computer.)
This chart shows the complete ranking, from best to worst in pounds of CO2e per passenger-mile.
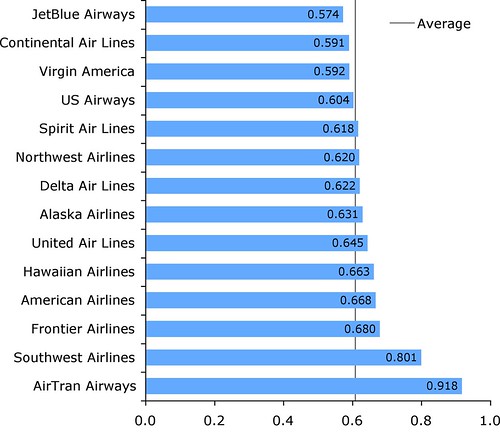
Note: a passenger-mile is one passenger flying one mile.
-Ian
-
Geeking out with carbon footprint calculations: the foodprint of EatingWell holiday recipes
Sometimes we really geek out with carbon emissions calculations at Brighter Planet. We crunch numbers down to the thousandth decimal in order to make recommendations about what is better to buy/do/eat in terms of one’s carbon footprint. In light of our Sustainable Cooking Contest(which runs two more weeks through December 31st!) and the stories we’ve received about reducing impact in the kitchen, we’re going to break down some fantastic holiday recipes from EatingWell for you.
Here are the general estimates for the carbon footprint of these recipes, measured in lbs. of C02e.

Horseradish crusted beef tenderloinand Vermont Cheddar Mashed Yukon Golds:
Total- 56 lbs CO2e, or 7 lbs per serving.
Beef kcal/serving- 220 servings- 8
lbs co2e- 34.5
lbs co2e/serving- 4.3Potatoes kcal/serving- 223
servings- 8
lbs co2e- 21.5
lbs co2e/serving- 2.7
Roasted Fall Vegetables in Cheddar Crust and Green and Yellow Beans with Wild Mushrooms:
Total- 38 lbs CO2e, or 4.6 lbs. per serving.
Vegetable Pie
kcal/serving- 378
servings- 8
lbs co2e- 29.8
lbs/serving- 3.7Beans/Mushrooms
kcal/serving- 75
servings- 10
lbs co2e- 8.3
lbs/serving- 0.8Choose the veggie-based dishes and you’ll have over 30% reduction in CO2e. This shows how replacing a few meaty holiday dishes with non-meat dishes, or choosing poultry and fish over red meats, can shave off a significant chunk of your “foodprint.” The other thing to keep in mind is that 11% of food emissions comes from transportation, so buying locally-sourced produce can decrease total food-miles from dirt to plate and reduce the total emissions.
If you want to do some more estimating and playing around with food emissions, check out the Food section of our Footprint Calculator.
-
Add your pets to your carbon footprint!

Ok folks, the day you’ve been eagerly awaiting has finally arrived. We’ve just turned on a new module in the footprint calculator that gives personalized pet emissions estimates – so go ahead and add your pets!
Believe it or not, pets actually do cause a sizable quantity of greenhouse gas emissions. The AVMA puts the number of dogs and cats in the US at over 150 million, plus tens of millions more horses, birds, and small animals; that’s a lot of mouths to feed. The vast majority of your pet’s climate impact comes from producing, transporting, and distributing its food, although we also figure in its share of the emissions from veterinary offices.
The average dog weighs in at about 2 tons of CO2 a year while the average cat emits about 1000 pounds, making the typical American citizen’s pet footprint about 1.8 tons per year (yes, I’m talking about people-years here). Of course, your pet footprint varies greatly depending on the number of pets you own and their species and size. As always, the calculator begins by assuming you own an average number of average pets, and incrementally adjusts that estimate as you provide more personalized info on your own pets.
Having pets does cause emissions, but there are plenty of things you can do to reduce that impact – having your animals fixed, being conscious about the ingredients and packaging in your pet food, and avoiding extraneous pet accessories all make a big difference. You can even join others in building renewable energy projects to offset your furry friend’s climate impact – that’ll really make her beam in adulation.
Oh and FYI, we’ll be working to add many more new functions (think recycling, hotels, entertainment, motorcycles, clothing, health care, rental cars…) to the footprint calculator as time goes on, so stay tuned.
-
Climate bill benefit at least double the cost.
Everyone talks about the costs of climate legislation. Opponents distort the numbers to make it seem too costly while supporters point out that cutting greenhouse gas emissions will be pretty cheap. But the cost is only half the story – what about the benefit?
It’s hard to monetize the benefits of avoiding climate change. But as Grist reported, a federal interagency task force has been hard at work and they recently released an interim estimate of the ‘social cost of carbon’ - the cost of inaction. They peg this at $19 per metric tonne of CO2.
What does this mean for pending climate legislation? An NYU law school paper (summarized here) applied the interim estimate to the Waxman-Markey American Clean Energy and Security Act. They found it would create $1.5 trillion in benefits, more than twice the EPA-estimated cost of $660 billion. Strengthening the bill to reduce more emissions would only improve the cost/benefit ratio.
Now factor in that the EPA says their cost estimate is almost certainly too high while the interagency task force says their benefit estimate is almost certainly too low (it leaves out things like the impacts of weather variability on agriculture, threats to national security, ocean acidification and coral reef death, and the spread of infectious diseases).
The upshot may have already been obvious to all of us who think it’s worthwhile to avoid catastrophic climate change. But it’s nice to have some numbers to throw around when you say passing strong climate legislation is the investment opportunity of an era.
-Ian
-
Think the Volt is greener than the Prius? Think again.
GM recently announced fuel economy figures for the plug-in hybrid Chevy Volt: a whopping 230 miles per gallon! Using the same EPA standards, a rival automaker, Nissan, reported that their all-electric Leaf would get 367 mpg.
Mind-blowing numbers, right? You would think the Volt or the Leaf will blow the 50 mpg Prius off the road. Not true in half of the country. The long and short of it is driving 100 miles in a Prius emits 40 lbs of CO2e across all states whereas driving 100 miles in a Volt in Kansas emits 53 lbs, in California 19 lbs, and in Massachusetts 25 lbs. When electricity comes from burning coal, the Prius is hands-down greener than charging your Volt from the garage outlet.
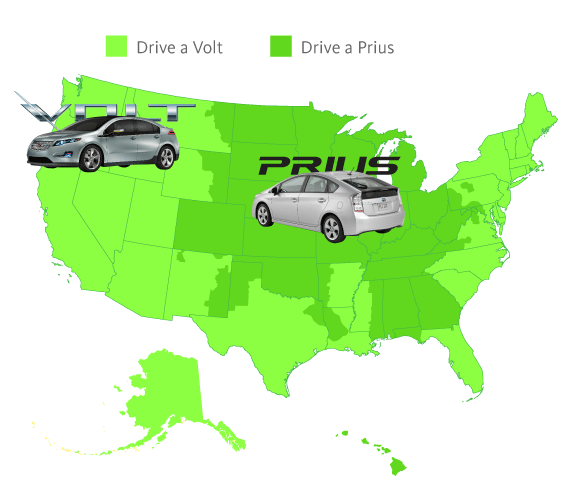
While we applaud products that reduce our dependence on foreign oil, it’s time to put the greenwashing brakes on the spin that electric cars are the environmentally friendliest throughout the land. Just because you can’t see the fossil fuels being burned to make electricity doesn’t mean they’re not being burned when you’re on a dirty grid. Let’s put the pedal to the metal on a new renewable energy infrastructure. Then plug-in hybrids and electric cars will be greener than ever.
For this comparison we used:
- 2010 Toyota Prius – 50 miles per gallon
- Chevrolet Volt – 25 kWh per 100 miles (running on electric only)
- Gasoline emissions – 19.777 lbs CO2e / gallon (based on US EPA GHG Inventory)
- Electricity emissions – year 2005 data from eGRID2007 v1.1
-
Sneak peek: the single biggest report on the future of the planet, ever
An important 6,700-page report (don’t worry, I’m about to summarize it for you) is coming down the pipeline. Written by world leaders and drawing on contributions from 2,700 experts from around the globe, this report will be the single biggest report considering the future of planet when it is officially published next month.
The 2009 State of the Future report, obtained by The Independent on Sunday, is backed by a diverse range of leading organizations such as Unesco, the World Bank, the U.S. Army and the Rockefeller Foundation.
The bad, but probably not surprising news, is first: the findings about climate change are grim.
- Half the world could face violence and unrest due to severe unemployment combined with scarce water, food and energy supplies and the cumulative effects of climate change.
- “The scope and scale of the future effects of climate change – ranging from changes in weather patterns to loss of livelihoods and disappearing states – has unprecedented implications for political and social stability.” In conclusion, climate change “will cause civilization to collapse.”
But, there are still some hopeful perspectives. The authors suggest the threats may end up being catalysts for positive change. “The good news is that the global financial crisis and climate change planning may be helping humanity to move from its often selfish, self-centered adolescence to a more globally responsible adulthood… Many perceive the current economic disaster as an opportunity to invest in the next generation of greener technologies, to rethink economic and development assumptions, and to put the world on course for a better future.”
And it is timely for us at Brighter Planet that the report also praises the web, as we consider ourselves a web-based climate change company. The web is singled-out as, “the most powerful force for globalization, democratization, economic growth, and education in history.”
Alongside from the positive force of the web, Jerome Glenn, director of the Millennium Project and one of the report’s authors, offered some concrete suggestions for a better future. “Three great transitions would help both the world economy and its natural environment– to shift as much as possible from freshwater agriculture to saltwater agriculture; produce healthier meat without the need to grow animals; and replace gasoline cars with electric cars.”
And, of course, to get to the place we need to be, there will have to be strong global agreements. “This is not only important for the environment; it is also a strategy to increase the likelihood of international peace. Without some agreement, it will be difficult to get the kind of global coherence needed to address climate change seriously.”
Here’s to positive forces, global agreements, and the future.
-
"Caveat emptor," says GOOD Magazine re carbon offsets. And we agree.
It’s all web-app, all the time here at Brighter Planet world headquarters—we’re totally immersed in making our soon-to-be-unwrapped rebuilt website as good as it can be before we open it up to early birds.
But I did take a few minutes today to catch up on reading, and now I’m carving out a few more to talk about GOOD Magazine’s recent post on carbon offsets. Writer Ben Jervey has served up a guide for anyone who’s thinking about purchasing carbon offsets, and it’s good stuff. His sage advice is “buyer beware,” and he goes on to name names of some offset providers who are trustworthy and one that, in his opinion, is not.
In my experience, Jervey’s caution is on target. Real carbon offsets are a legit way to neutralize your remaining carbon impact once you’ve reduced your emissions as much as possible. But there are “rip-offsets” for sale out there as well, and buying them is a terrific way to get nothing for something.
How to tell the good from the bad?
As we’ve looked at projects to add to our portfolio over the last 18 months, we’ve subjected each to intense scrutiny. Those selected to date have been the best of the best from NativeEnergy, cited in GOOD’s piece as one of three trusted sellers. The piece also pulls some good questions for buyers to ask, from a report by Clean Air-Cool Planet, our partner on retiring carbon offsets once they’ve been used.
Here’s how we do it at Brighter Planet:
-
Brighter Planet earns the trust of our 100,000 customers by providing practical education about their lifestyle’s impact on climate and helping them find ways to reduce it.
-
We make it easy for our customers to offset their remaining impact by supporting real, additional, transparent projects that help local communities and the environment.
-
We meticulously review every project to ensure it meets our carbon offset policy and only accept those that are unanimously approved by the highly respected luminaries who sit on our project selection committee.
-
We work with Clean Air-Cool Planet, a non-profit organization, to ensure that every offset we sell is permanently retired and can’t be double-sold.
-
Finally, we subject all our processes to an annual third-party audit to make sure we’ve done what we said we were going to do.
In this still-maturing business, a company’s values – its commitment to using the best available science, to complete accountability, to transparent process, to simply doing things the right way – are of paramount importance. We know our offsets are on solid ground, and we’ve made sure to implement systems to keep it that way.
Offsets alone clearly aren’t enough to tackle climate change, but they can be an important part of the solution by funding much-needed renewable energy projects. Ultimately, offsets fulfill their potential when they’re held to high standards.
–Ian Hough, science guy @ Brighter Planet
p.s. - Ben Jervey’s a good friend of ours; he might be characterized as a James Brown of environmental journalists – the “hardest working man in the [green news] business.” We’ve no idea how he manages to write for GOOD, HuffPo Green, and his own SustainNYC; manages and writes for Greenlight, a citizen-journalism project from NRDC’s OnEarth Magazine; co-founds start-up web enterprises; and writes books. With an overflowing schedule like that, we’ll give him a pass for not including Brighter Planet in his carbon-offsets piece – even though he’s rocking our 350 Challenge badge (and thus earning offsets!) on SustainNYC. ;-)
-
-
New Year, New Offset Policy
As we kick off 2009, we’d like to introduce you to our new carbon offset policy. As with most new models, you’ll find that little has changed from our current PANTS policy. But the start of a new year, our second since launching, seemed a good time to pause, reflect, and distill our experience into an update of what constitutes a quality carbon offset.
The result of that process is RATE:
Real
Real offsets are permanent emissions reductions that are properly quantified, audited, and retired. Brighter Planet offsets cannot be invalidated by future events, are tracked and accounted for, and are not double-sold or double-counted.
Additional
A project that is additional would not have been built were it not for the prospect of receiving proceeds from the sale of offsets. Brighter Planet will not invest in projects that would have occurred anyway, as they produce no extra reduction in emissions and therefore do not produce bona fide carbon offsets.
Transparent
Complete transparency throughout the offset lifecycle is essential, given the inherent intangibility of carbon offsets and the absence of regulation in the voluntary market. Brighter Planet’s process includes a public comment period for projects under consideration, disclosure of our Project Selection Committee’s decisions, posting of project documents online, and an annual audit of sales and retirements.
Environmental and Social Value Added
Projects with environmental and social value added fight climate change while also helping solve other pressing challenges facing our communities and ecosystems. Brighter Planet invests in community-based climate solutions that also address issues like public health, biodiversity, poverty, and water quality.
RATE is what our Project Selection Committee will use to evaluate new offset projects being considered for inclusion in our portfolio. We like it, but we also want to know what you think. Please let us know by commenting below.
To see PANTS and RATE side by side, along with an explanation of our changes, click here.
Thanks!
–The Brighter Planet Team

Who's behind this?
We're Brighter Planet, the world's leading computational sustainability platform.
Who's blogging here?
What are we talking about?
Site generated by jekyll at 2015-05-28 14:08:00 +0000